Improved Risk Analysis Overview
Our June 17 release sees us continuing to improve and build on risk management in Bpanda. The process manager and BPM manager can now also see the risk analyses which are currently running as well as the completed risk analyses. The risk analyses currently running can be recognized by their orange label. You can quickly see if there are any risk analyses which are currently running that you can carry working on or complete.
The previous risks vs chances balance (bottom left) has now been replaced by the risk and chance matrix in the risk management dashboard. This is the same matrix that you already use to evaluate risks and chances. You can use a switch to simply switch between the matrix graphics in the dashboard. The color of the matrix is more intensive the greater the number of the respective risk. We now have an additional tab in the dashboard: Compare. You can use this to compare risk management key indicators from two different points in time. You can click through the Risk Management and Risks by Category graphics to see the risks at both points in time next to one another in a table. This allows you to easily recognize how the respective risks have developed over the period of time.


Process Map Overview
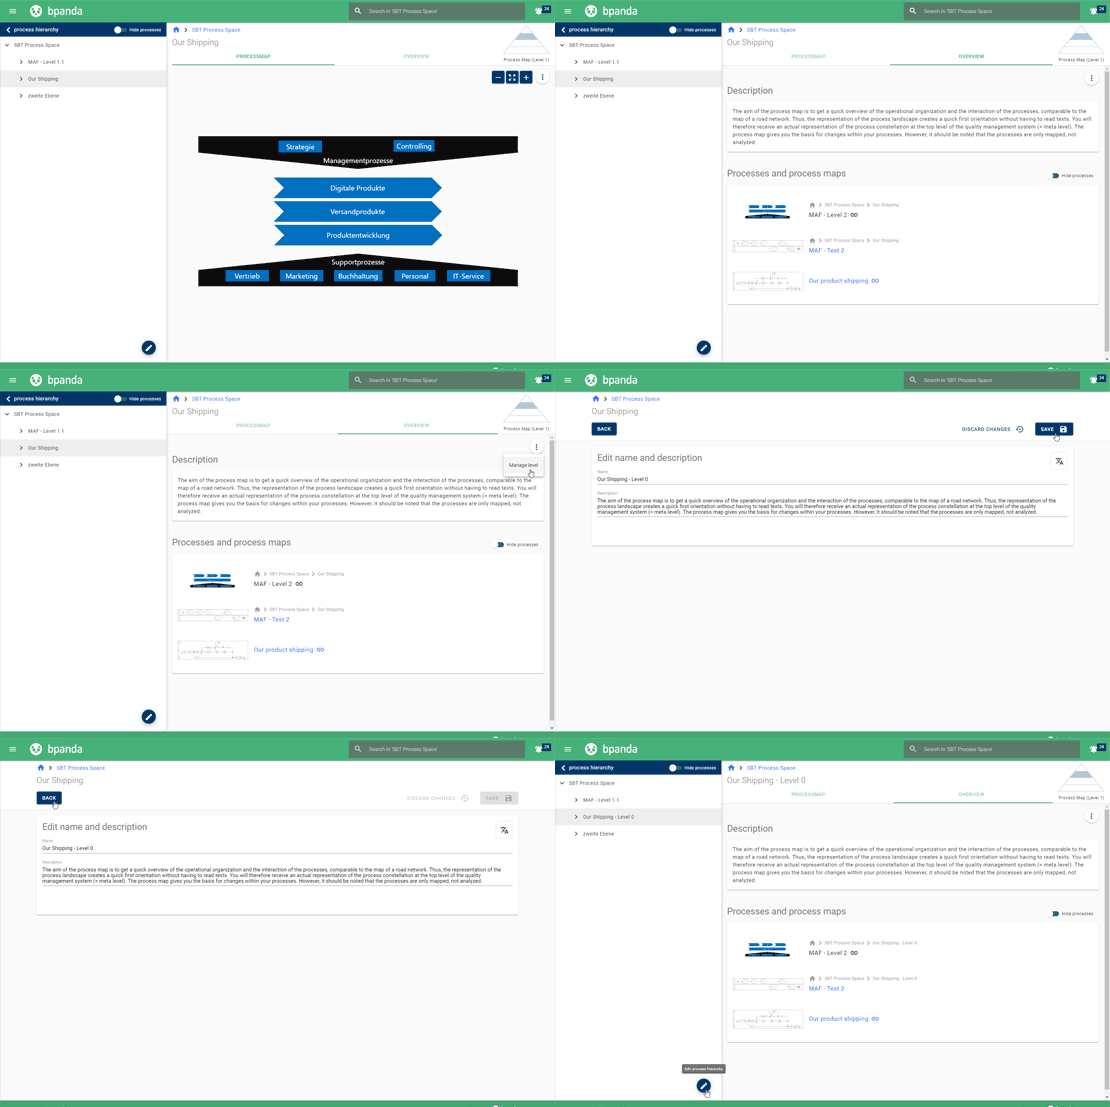
We’re sure you’ve already heard that our April release brought with it the new process hierarchy to Bpanda. Well, there is now both the Process Map and the new Overview tab. The Overview tab contains a description of the respective level, as well as information about the processes that were assigned to that level. Processes that are merely linked but not assigned to this level are also shown here. BPM managers can also manage the individual levels in this tab and add descriptions and translations. You can edit the process hierarchy by clicking on the blue pen; this will take you directly to the process space management. Go on… give it a go?!
Improved UX for the Modeler
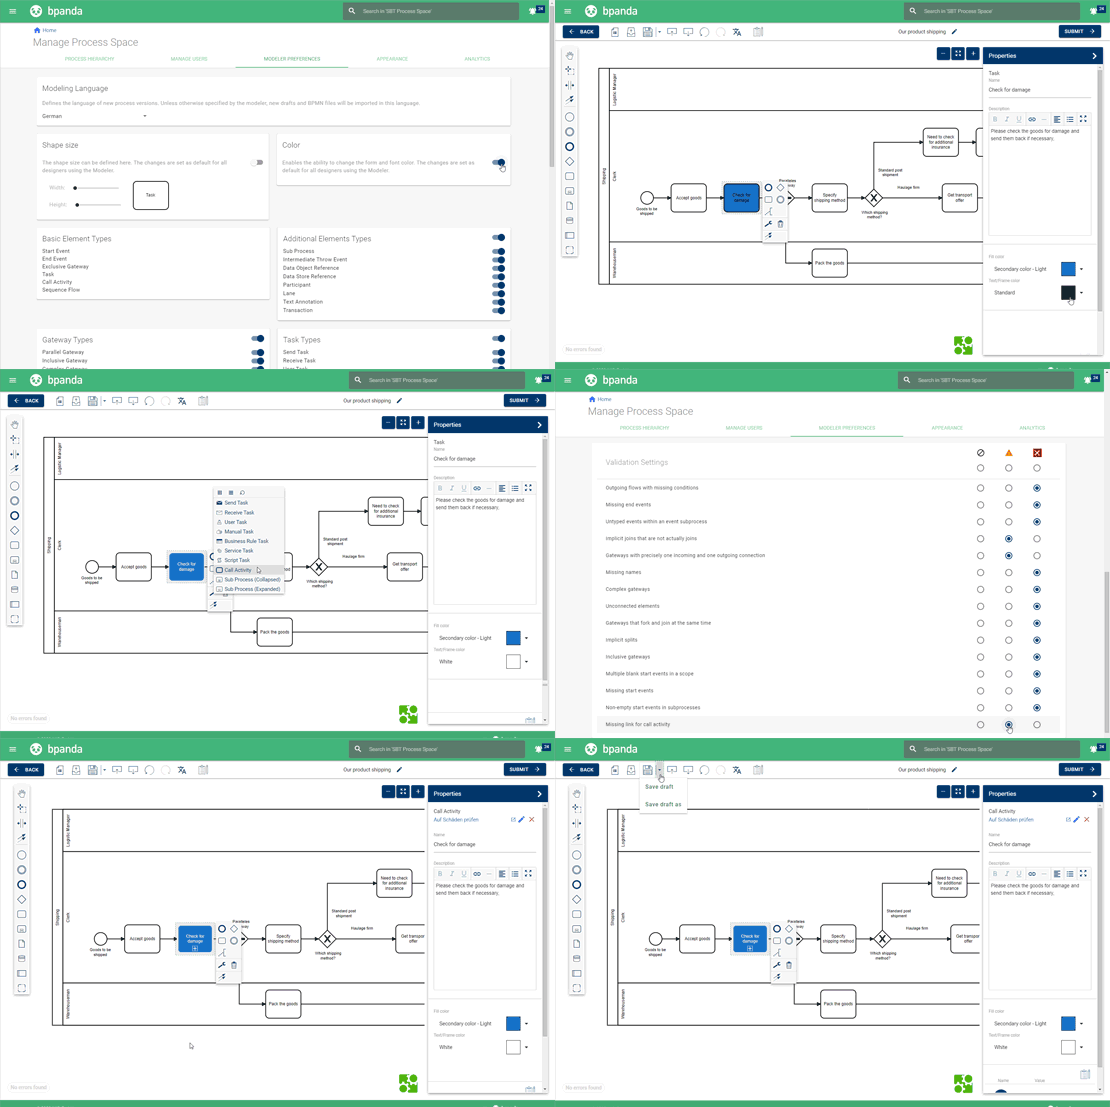
We have made new improvements to the Modeler. You can now also change the color of elements in your process when modeling, e.g. an individual task or gateway. You can color both the element’s fill color (default: white) and the text/frame color (default: black). You first need to activate the new “Color” function in the Modeler settings.
You can now also check whether a link to the call activity is missing or not. If this is the case, then this is shown as a red “x” or a warning with a yellow “!”, as was previously the case depending on your settings. You can then quickly link the call activity in the Modeler. The BPM manager also makes the changes in the Modeler settings. Last but by no means least, the storage function has also been simplified. Once you have saved your process draft via “Save as” for the first time, then any other modeling you carry out only needs to be saved by clicking on the Save button.


New Notification for Jobs
You used to previously be sent a notification if a job was directly assigned to you. You will now also receive a notification and e-mail if a job is assigned to a group or organizational unit you belong to. e.g. If five people belong to an org unit, then they will all receive the same notification: The job ‘xy’ can be taken. This is also shown under Your Tasks. This guarantees that no job will slip through the net and all those involved will be informed.