Improved Overview and Editing Options for Process Hierarchy
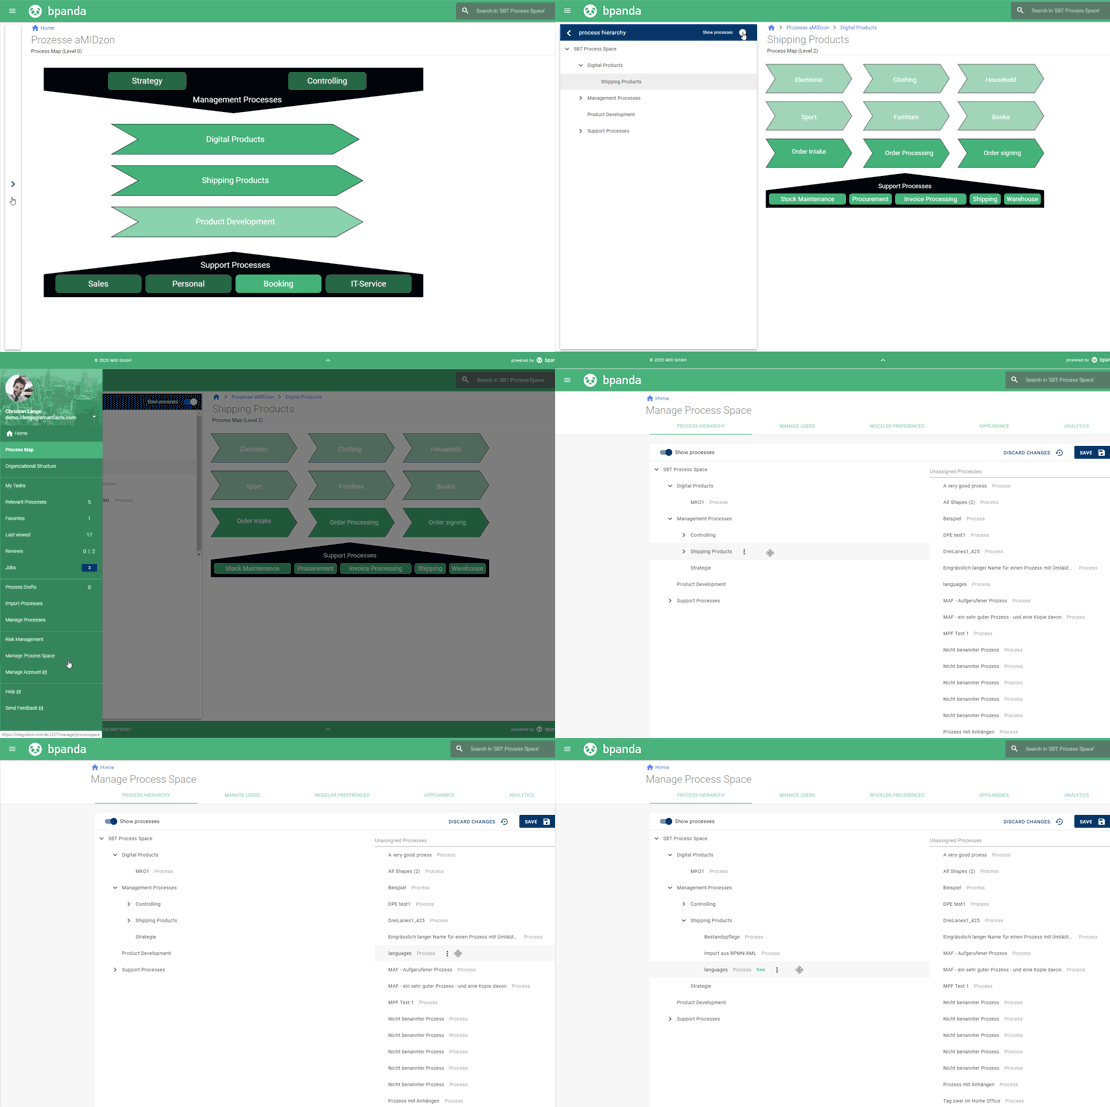
This April 15 release brings with it lots of changes to the process hierarchy in Bpanda. The process hierarchy will now be shown as both a process map and an easy to ready tree view for all Bpanda users, process users and BPM managers. You can easily open this view by clicking on the new side menu next to the process map. This new folder view makes it easy to quickly get a complete overview of your process landscape and its hierarchy. You can show and hide the various levels and view the corresponding SVG for each level. You can also view the processes for the respective level. This means you can now use both the process map and the tree view for checking out your process landscape.
For BPM managers, this change means that processes and levels can be assigned or added using “Manage Process Space” in the main menu and the process map is no longer used for it. The “Process Hierarchy” tab is also a new addition to the menu. You can view the process hierarchy as a tree structure here. You can easily change the structure of existing levels using Drag & Drop or rename levels or add new sublevels using the submenu if you are e.g. just getting started with structuring your process landscape. All processes which haven’t been assigned yet can be seen to the right next to the process hierarchy; you can now simply drag the process and drop it on the appropriate level. Simply save your changes to make them visible to everyone else working in the process space. What are you waiting for? Get going and check out the new view!


Exporting Process Maps from Innovator to Bpanda
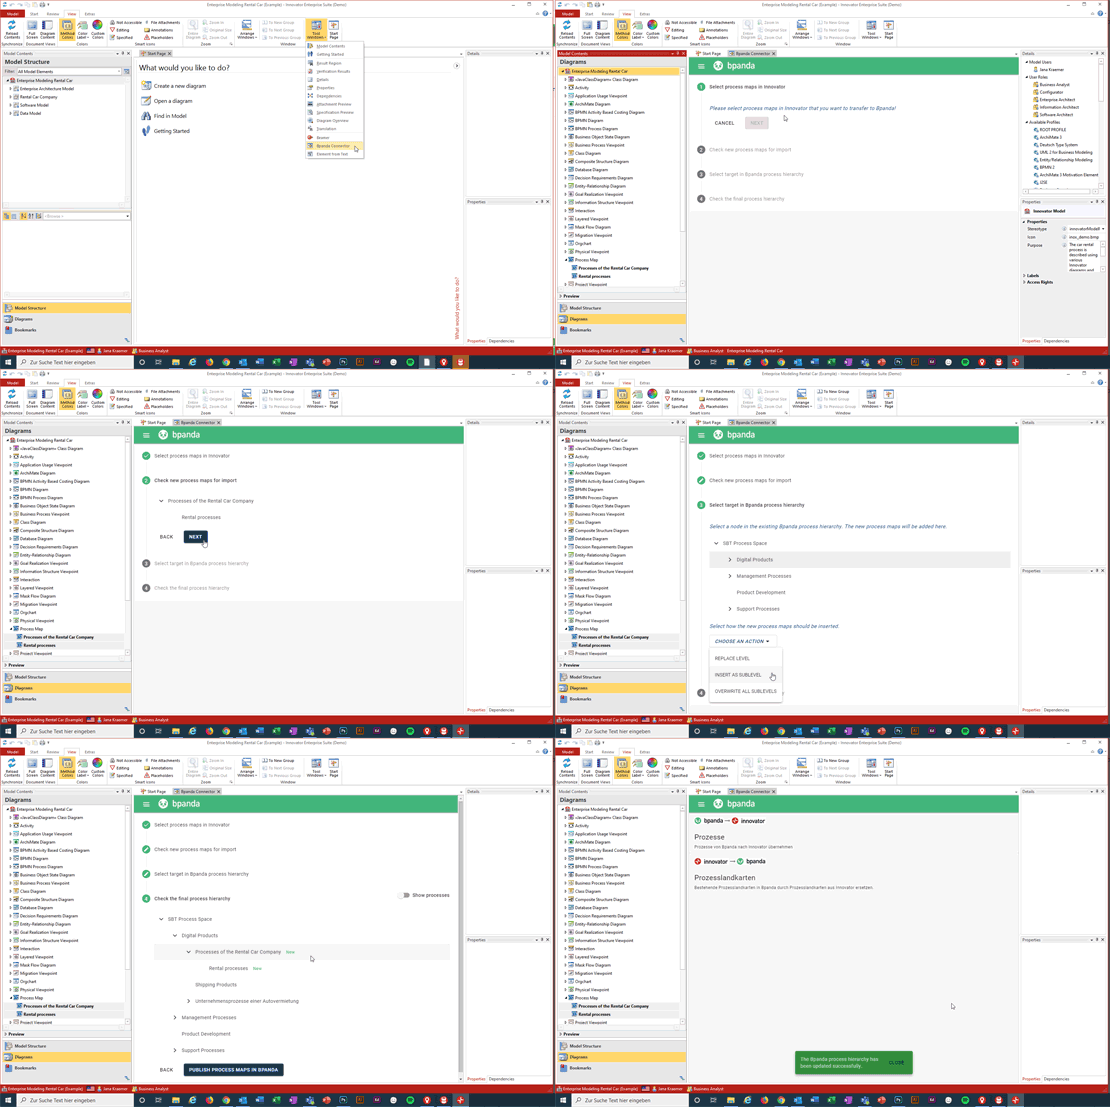
There’s good news for all Bpanda users who also use our modeling tool Innovator: You can use the connector to transfer all process maps modeled in Innovator to Bpanda. All links, both below and to the processes, are retained. This process map export from Innovator to Bpanda complements the previous way of adopting processes from Bpanda to Innovator. Important: the Bpanda-Innovator connector is available with Innovator 14.1 or later versions.
Risk Management
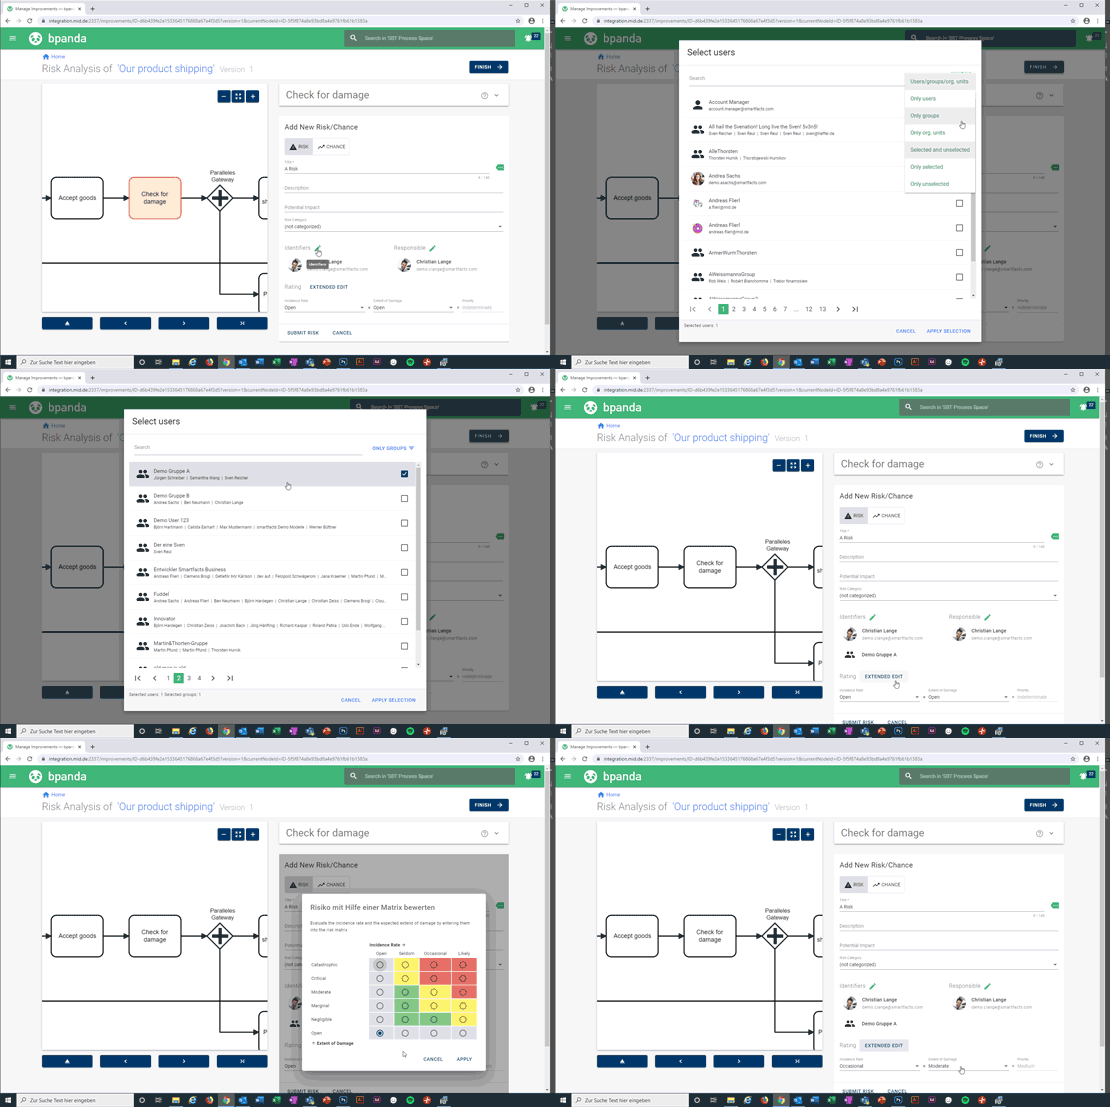
You previously only used to be able to explicitly assign a single person as identifier when creating a chance or risk in Bpanda. You can now also assign organizational units and groups at the same time as well. This also applies for controls too. Sometimes an entire department, a certain team or a mixture of department, team and individual person are necessary to identify the chance or risk and control it.
As well as the previous drop-down lists, a graphic matrix is now also available for risk assessment. This matrix can be found under “Advanced Editing”.


New Analysis Interval and Jobs Overview
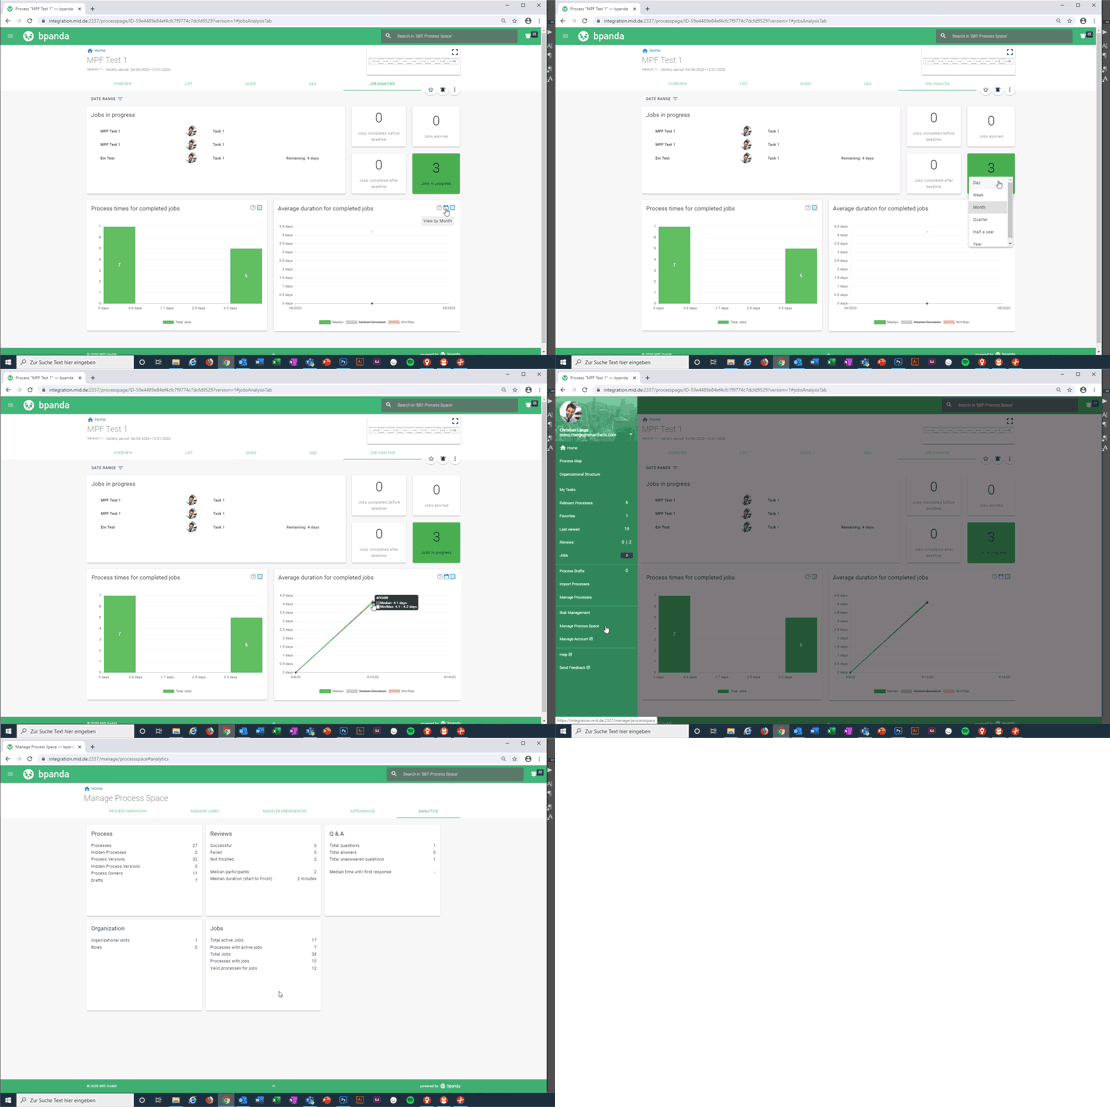
You can now also use the Jobs Dashboard for analysis to set other time intervals in the diagram which evaluates the mean process time. You can use the calendar icon to choose between day, week, quarter, half a year and year for a more precise analysis of process times for your jobs.
BPM managers now have an extra tile under “Manage Process Space” with an overview of all jobs in the process space. These key indicators show you how many jobs are currently running, have ever run and for how many processes jobs have previously been created for. You can also find out how many of your processes are suitable for Jobs. Use this information to optimize how you use Jobs in Bpanda!